Entendiendo el panel de control de Papermark
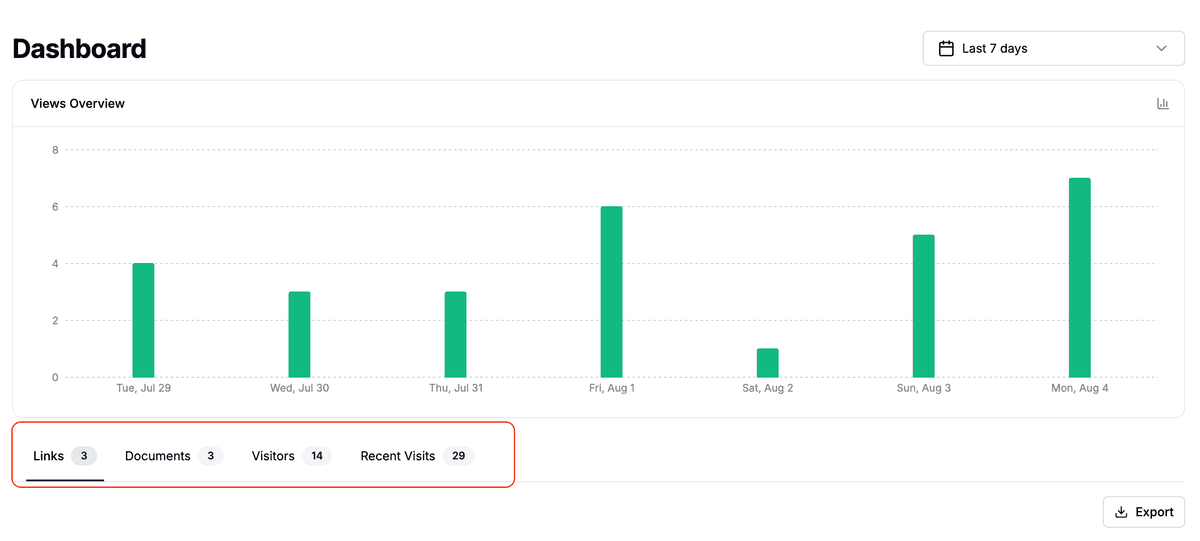
El panel de control de Papermark te ofrece una vista panorámica del rendimiento de tu contenido. Desde un solo lugar puedes hacer seguimiento de la actividad de los enlaces, la interacción con documentos, el comportamiento de los visitantes y cada visita reciente en tu espacio de trabajo.
Lo que verás primero
- Tarjetas de resumen – totales clave de visualizaciones, visitantes y documentos compartidos.
- Gráfico general de visualizaciones – un gráfico de barras interactivo que muestra las visualizaciones durante el rango de fechas seleccionado.
- Selector de rango de tiempo – filtra los análisis por rangos predefinidos (24 h, 7 d, 30 d) o un rango personalizado.
- Pestañas de análisis – cambia rápidamente entre tablas detalladas de enlaces, documentos, visitantes o visitas recientes.
Pestaña de enlaces
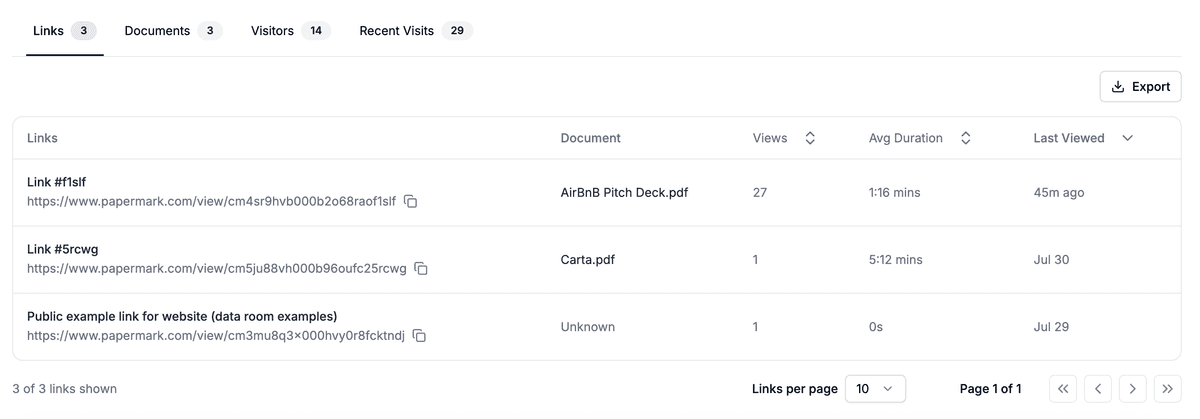
La pestaña Enlaces muestra todos los enlaces compartibles que has creado. La tabla incluye:
- Enlace – nombre más la URL completa (pasa el cursor para revelar un icono de copiar al portapapeles).
- Documento – el archivo al que apunta el enlace (o Desconocido si el archivo fue eliminado).
- Visualizaciones – total de visualizaciones en el rango seleccionado; haz clic en el encabezado de la columna para ordenar.
- Duración promedio – tiempo promedio que cada visitante pasó en el enlace.
- Última visualización – fecha relativa o de calendario de la visualización más reciente.
Un botón de Exportar en la esquina superior derecha te permite descargar la lista en formato CSV. Los controles de paginación y un selector de "Enlaces por página" aparecen debajo de la tabla.
Usa el selector de rango de fechas para filtrar los resultados. Los datos son proporcionados por el componente LinksTable y el recuento links en la API del panel.
Pestaña Documentos
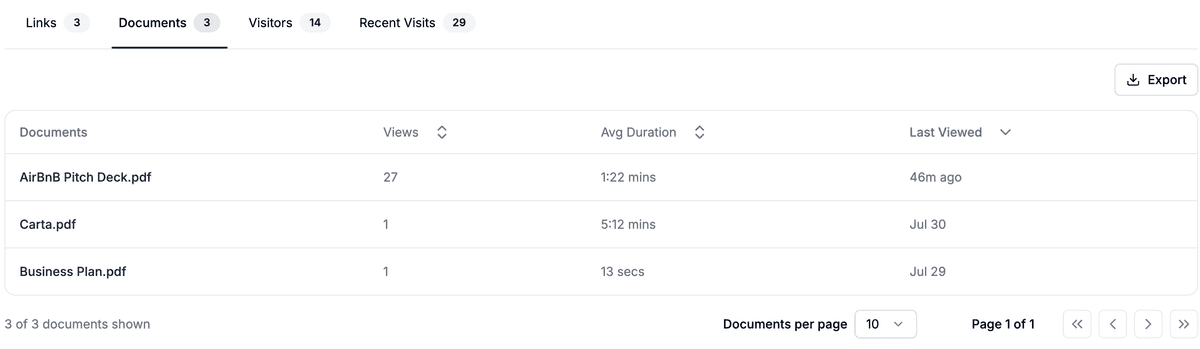
La pestaña Documentos muestra análisis para cada archivo subido. Las columnas incluyen:
- Documento – nombre del archivo (haz clic para abrir el registro del archivo).
- Vistas – total de vistas en el rango seleccionado.
- Duración promedio – tiempo promedio que los visualizadores pasaron en el documento.
- Última visualización – cuándo se accedió al documento por última vez.
Al igual que la pestaña de enlaces, un botón de Exportar proporciona una descarga rápida en CSV, y los controles de paginación aparecen debajo de la tabla. Las filas se ordenan por defecto según las vistas más recientes para que puedas identificar los documentos en tendencia de un vistazo. El componente subyacente es DocumentsTable.
Pestaña Visitantes
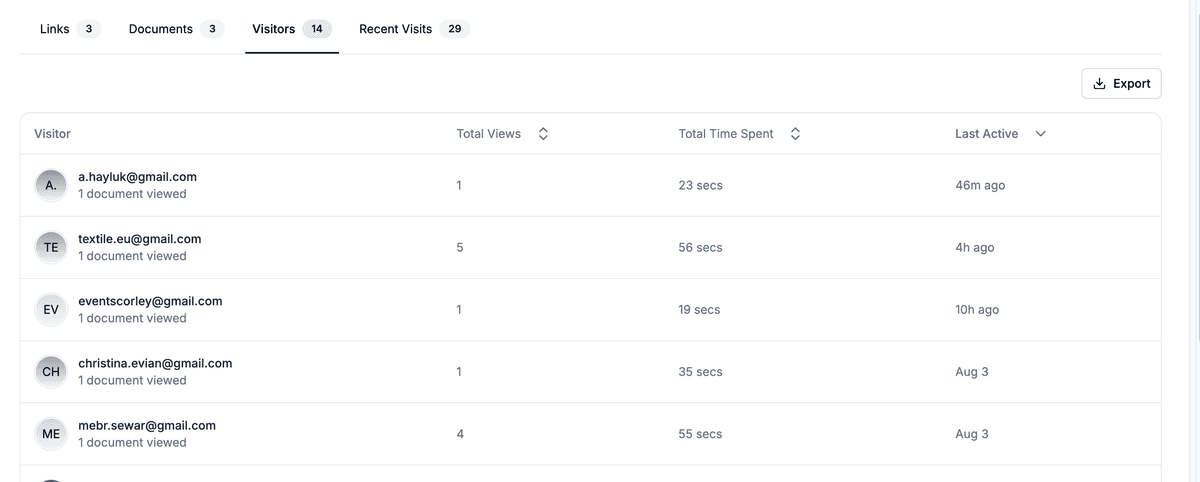
La pestaña Visitantes se centra en las personas en lugar del contenido. La tabla muestra:
- Visitante – avatar con iniciales más correo electrónico (o etiqueta anónima) y una pequeña leyenda como "1 documento visto".
- Total de vistas – número de veces que el visitante abrió cualquier enlace en el rango seleccionado (ordenable).
- Tiempo total – tiempo acumulado que el visitante pasó con tus documentos.
- Última actividad – última vez que el visitante vio algo.
Un botón de Exportar se encuentra en la esquina superior derecha y la paginación aparece debajo de la tabla. Los datos provienen del componente VisitorsTable.
Pestaña Visitas recientes
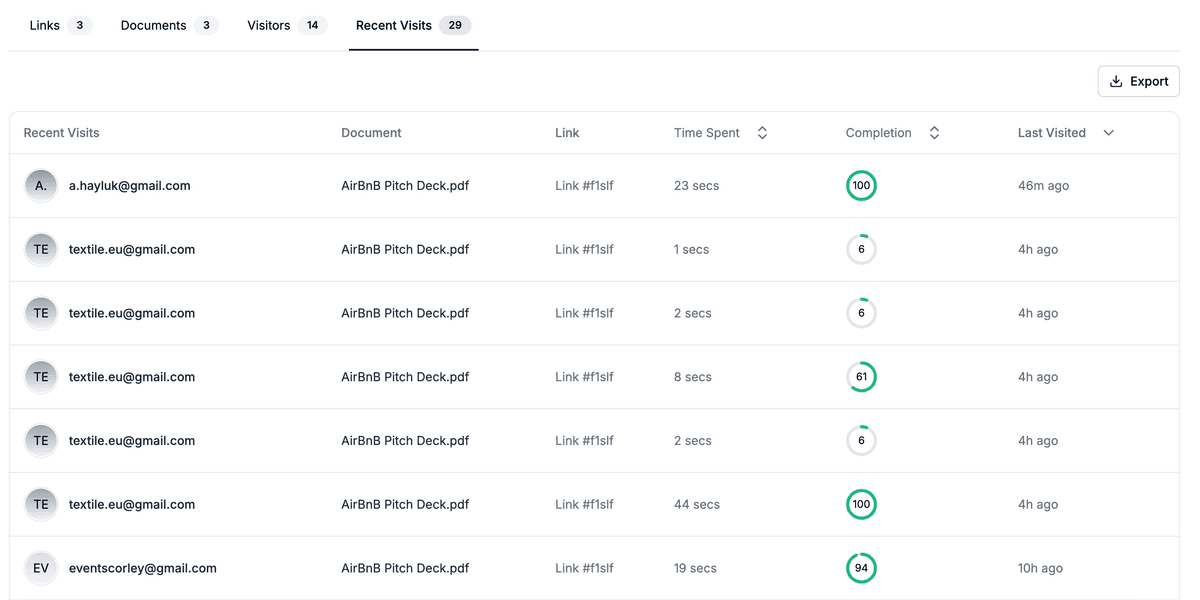
La pestaña Visitas recientes proporciona un feed en tiempo real de cada evento de visualización. Las columnas incluyen:
- Visitas recientes – avatar y correo electrónico del visitante.
- Documento – nombre del archivo que fue abierto.
- Enlace – el enlace de compartir específico utilizado.
- Tiempo empleado – cuánto tiempo permaneció el visitante en el documento durante esa visita.
- Finalización – círculo de finalización de página que muestra cuánto del documento fue leído.
- Última visita – marca de tiempo relativa (por ejemplo, "hace 4h").
Usa esta vista cuando necesites información actualizada al minuto mientras presentas. Al igual que otras pestañas, un botón de Exportar permite la descarga en CSV. La tabla es renderizada por el componente ViewsTable.
Consejos para usar el panel
- Rangos personalizados – haz clic en el icono del calendario para elegir cualquier fecha de inicio y fin.
- Contadores en pestañas – el número junto a cada encabezado de pestaña es el total para el rango actual (consulta
overview.countsen el código). - Filtros premium – algunos filtros avanzados (como el tipo de dispositivo) están disponibles en planes de pago; el componente PlanGuard te solicita actualizar si es necesario.
- Exportar datos – cada tabla puede exportarse a CSV mediante el icono de descarga en el encabezado de la tabla.
Próximos pasos
¿Quieres profundizar más? Explora estos recursos:
- Visita nuestro centro de ayuda para guías sobre cómo empezar, subir documentos y más.
Para ayuda adicional, contacta a support@papermark.com.