
How to use detailed analytics for your data room?
Knowing that a visitor opened your data room isn't enough. Detailed data room analytics show you exactly which documents got attention, where visitors spent time, who downloaded what, and how they moved through the rooms, so you can follow up at the right moment with the right context.
Detailed data room analytics are available on the Data Rooms plan and above.
What you can see
The detailed analytics view gives you a complete picture for every visitor and every document:
- Visit summary: number of visits, unique visitors, average time spent
- Document-by-document engagement: views, time spent, downloads per file
- Folder-level engagement: aggregated time per folder
- Visitor journey: the order in which each visitor opened documents
- Page-level analytics: time spent per page within each document
- Download tracking: who downloaded what and when
- Geographic data: where viewers are located
- Group analytics: aggregate engagement per visitor group
- CSV export: pull everything into a spreadsheet for follow-up or reporting
Step-by-step: access detailed analytics
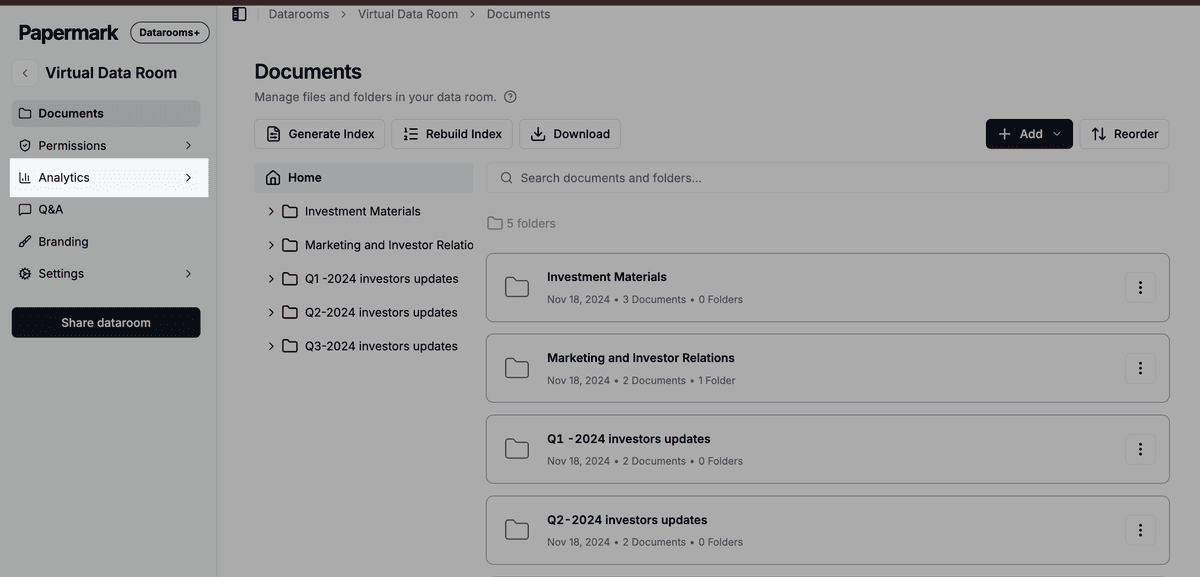
Step 1: Open analytics for a data room
- Log into Papermark.
- Click Datarooms in the sidebar.
- Open the data room.
- Click the Analytics tab.
You'll land on the overview, with summary metrics for all visitors.
Step 2: Drill into a visitor or document
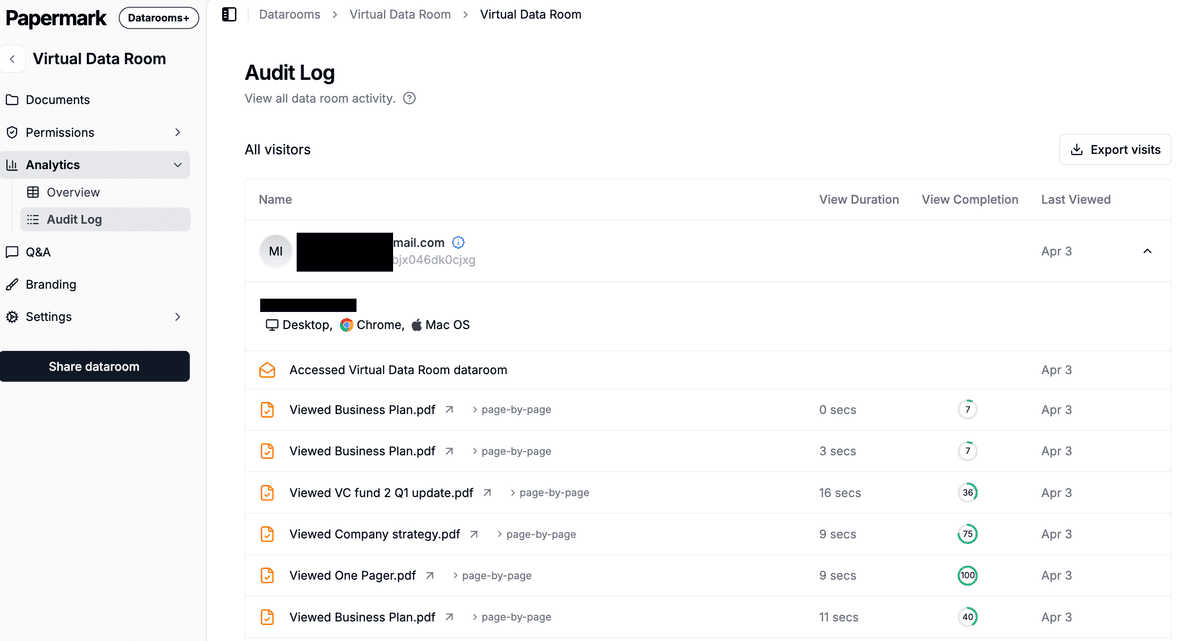
- Click any visitor row to see their full journey, time per document, and downloads.
- Click any document row to see who viewed it, time spent, and per-page engagement.
- Use the date filter to focus on a specific period.
Step 3: Export to CSV
- Click Export at the top of the analytics view.
- Pick the data you want (visits, downloads, per-page metrics).
- Click Download CSV.
The export includes every visitor and every document interaction for the period you selected.

What the metrics mean
- Views: number of times a document was opened
- Unique visitors: number of distinct people who opened the document
- Time spent: total time the document was open in the viewer (only counts active viewing, not background tabs)
- Downloads: number of times the file was downloaded
- Engagement: a composite indicator combining time spent and pages viewed
- Completion: percentage of pages viewed in a multi-page document
How analytics interact with permissions
Detailed analytics respect your data room permissions:
- You see analytics for every visitor and every document, since you're the admin
- Visitor groups can be filtered separately so you can compare engagement between buyer tiers
- Hidden documents don't show up in visitor analytics (because visitors couldn't see them)
- Files protected by granular permissions only show analytics from visitors who had access
Use cases
- Sell-side M&A: see which buyers spent the most time on financials versus customer contracts, so you know who's serious.
- Fundraising: track which slides of your pitch deck investors re-read and which they skip.
- Investor reporting: confirm that LPs actually opened the quarterly report.
- Compliance reviews: prove which reviewers opened which policy documents and when.
- Buyer outreach: notice when a buyer revisits the same document multiple days in a row and follow up.
Best practices
- Set up visitor groups before launch. Group-level analytics are much more useful than individual-only views.
- Use the document level to spot interest. If 80% of buyers spent time on Section 3 of the financials, your follow-up email should reference Section 3.
- Export weekly during a deal. Pull a CSV at the end of each week to track engagement velocity.
- Combine with Q&A conversations. Heavy engagement plus open questions usually means a buyer is close to a decision.
Frequently asked questions
Related guides
- Understanding the Papermark dashboard
- How to export Data Room visits to CSV
- Viewer Analytics in Papermark
- How to track page-by-page analytics
Need help? Contact support@papermark.com or use the in-app chat.