
Releasing the Papermark Startup Fundraising Report
Today we are publishing the Papermark Startup Fundraising Report: how investors actually read your pitch deck, measured across 24,541 decks, 358,672 investor views and the rounds that closed afterwards.
Every founder sends a deck link and then waits. What happens on the other side is usually a guess. Papermark records how decks are read page by page, so for the first time we could put numbers on the part of the raise founders never see: 15.2 million page-level data points, 1,374,380 minutes of reading, from investors in 184 countries.
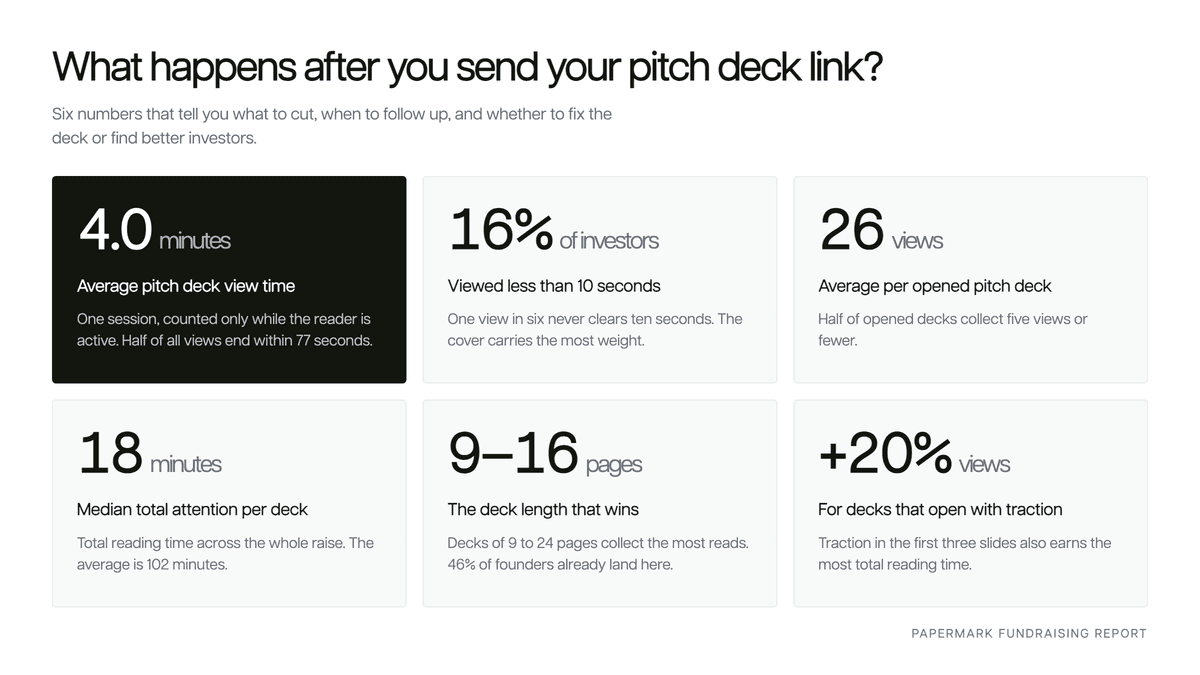
1. You get four minutes, and you have to earn them
The average investor view lasts 4.0 minutes, and half of all views end within 77 seconds. Investors either dismiss a deck in seconds or sit down and read it: 16% of views end inside ten seconds, while another third run past three minutes. Across a whole raise, the median deck collects 18 minutes of attention from about 11 unique investors.
Decks from companies that went on to close a round collected twice that: 36 minutes of total reading against 18 for the typical deck.
2. Most investors never reach the last slide
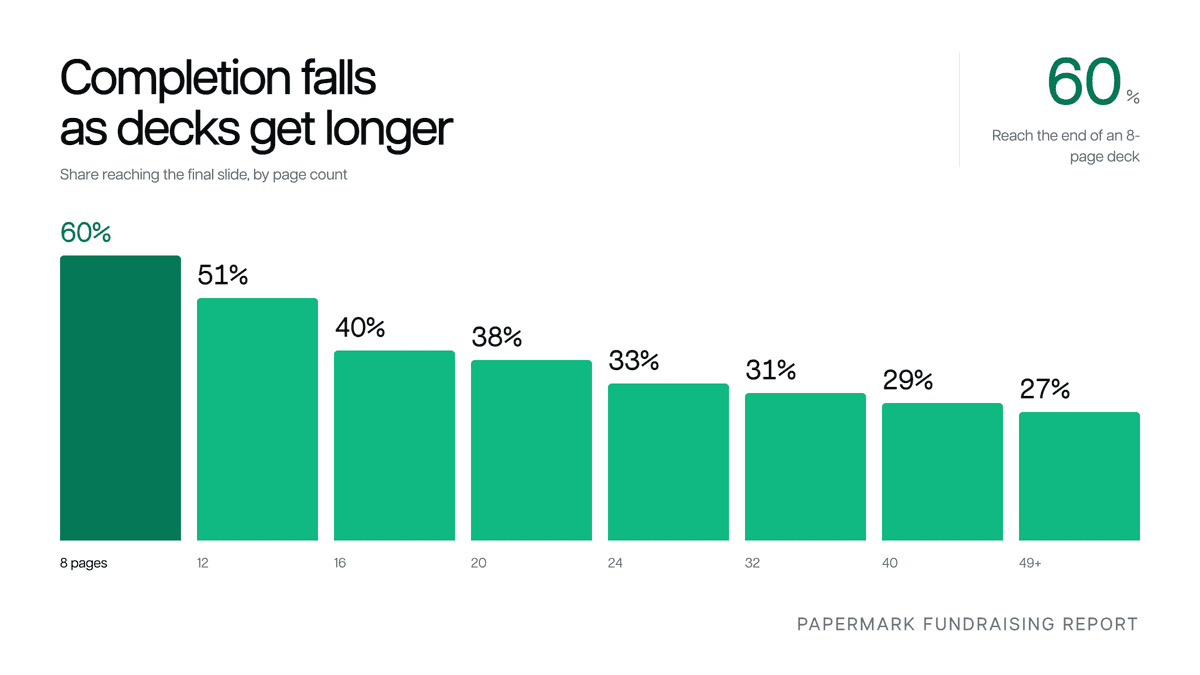
Your ask is usually on the last slide, and fewer than half the investors who open a deck get there. The biggest drop happens between slide one and slide two. The report's advice: put your best fact in the first three slides, and treat everything past slide twelve as material for investors who are already interested.
3. The sweet spot is 9 to 16 pages
Length changes how a deck is read. Decks of 9 to 16 pages are where 46% of founders land, and going from 8 to 16 pages costs about 20 points of completion. Slide by slide, the sweet spot sharpens to 12 slides: twelve-page decks collect the most views of any exact length, 34 on average, and the highest share of return visits at 68%.
4. Investors spend longest on the slides founders leave out
The report compares how long investors spend on each slide type with how often founders include it. Financials hold above-median attention but appear in only four decks in ten. The team slide is the most read, at 5.7 seconds per view, and the cover holds about 45% more time than the median page, because it is where the investor decides whether to keep going.
5. Signals that tell you when to follow up
Beyond reading time, the report covers sharing and protection, revisits as a signal of real interest, how long a raise takes, video pitches, benchmarks for comparing your own deck, and where investors read from. Each section ends with a concrete way to improve your deck.
How we built it
The report uses anonymized, aggregated data from pitch decks shared through Papermark between 2024 and 2026. No individual deck, company or investor can be identified. Papermark is the secure, modern data room and document sharing platform that more than 70,000 companies use to share decks and close deals.
Want the same page-by-page insight on your own raise? Share your deck with a Papermark link and see who reads what.